If you've ever tried navigating a busy city at rush hour without a map, you know the feeling—wrong turns, wasted gas, and a whole lot of frustration. Running an e-commerce supply chain without data is pretty much the same: a series of expensive guesses based on incomplete information.
This is where logistics analytics comes in. It’s the process of using data to make smarter, faster, and more profitable decisions across your entire operation. It turns guesswork into informed strategy, helping you optimize inventory, speed up deliveries, and slash costs.
What Is Logistics Analytics and Why Does It Matter?

Think of logistics analytics as the GPS for your supply chain. It’s the systematic use of data to improve performance, from the moment a customer clicks "buy" to the second their package lands on their doorstep.
For a growing e-commerce seller, it’s the key to answering the tough questions that directly hit your bottom line:
- Inventory: Where is my best-selling product right now, and am I about to stock out?
- Shipping: Are my packages actually arriving on time? How can I stop overpaying for shipping?
- Fulfillment: What’s the biggest bottleneck in my warehouse that's slowing down orders?
To really get a handle on logistics analytics, it helps to see it as a tiered system. Each level builds on the last, answering a progressively more powerful question—kind of like how a weather forecast evolves from a simple observation to actionable advice.
Before we dive into the levels, here’s a quick overview of what each area of logistics analytics can tell you.
Table: Key Focus Areas of Logistics Analytics
| Analytics Area | What It Measures | Key Question It Answers for Your Business |
|---|---|---|
| Inventory Analytics | Stock levels, turnover rates, storage costs, stockout frequency | "Do I have the right amount of the right products in the right place?" |
| Transportation Analytics | On-time delivery rates, cost per shipment, transit times, carrier performance | "How can I ship faster and cheaper without sacrificing quality?" |
| Fulfillment Analytics | Order cycle time, pick-and-pack accuracy, labor productivity, cost per order | "Which part of my fulfillment process is slowing me down or costing too much?" |
| Demand Analytics | Sales velocity, seasonal trends, customer buying patterns, promotional impact | "What are my customers going to buy next, and how much of it will they need?" |
Each of these areas provides a different lens through which to view your business, giving you a complete picture of your operational health.
The Three Levels of Logistics Analytics
Descriptive Analytics (What happened?): This is the starting point—looking back at historical data to figure out what went right or wrong. A report showing that 75% of your shipments were delivered on time last month is pure descriptive analytics. It’s the weather report telling you it rained yesterday. Simple, but necessary.
Predictive Analytics (What will happen?): This is where things get interesting. Using that historical data, you can start building statistical models to forecast what's coming next. For example, a predictive model might forecast a 20% jump in demand for a specific SKU next quarter based on seasonal trends and recent sales. This is the forecast telling you there’s an 80% chance of rain tomorrow.
Prescriptive Analytics (What should we do?): This is the most powerful level. It doesn't just predict the future; it recommends specific actions to take. A prescriptive system could automatically suggest re-routing a shipment to avoid a predicted snowstorm or tell you exactly how much extra inventory to order to meet that forecasted demand. This is your weather app not only telling you it will rain but advising you to grab an umbrella before you leave.
By moving from simply looking at the past to predicting the future and prescribing actions, logistics analytics lets you get ahead of problems. You become proactive, not reactive. You can learn more about building these skills in our guide to supply chain and warehouse management.
This shift to data-driven decision-making isn’t just a nice-to-have. It’s fundamentally changing how modern supply chains are run. The global digital logistics market is expected to hit an incredible USD 338.47 billion by 2035. That explosive growth is all thanks to businesses using analytics to cut costs and get a leg up on the competition. For any scaling e-commerce brand, using data is no longer optional—it's essential.
The Building Blocks of a Powerful Logistics Data Strategy
A solid logistics analytics strategy isn't built on guesswork; it’s built on good, clean data. Think of it like building a house. You can’t put up walls or a roof until you have a rock-solid foundation. In logistics, your foundation is made of key metrics and the data sources where they live.
The whole point is to go from a blurry, outdated snapshot of your operations to a crystal-clear, real-time picture. That clarity starts with tracking the right numbers.
Key Metrics Every E-commerce Brand Should Track
For an e-commerce brand, not all metrics are created equal. Trying to chase dozens of data points will just leave you confused and chasing your tail. Instead, focus on a handful of vital signs that tell you exactly how healthy your fulfillment operations are.
Order Accuracy Rate: What percentage of your orders are shipped without a single mistake? That means the right product, in the right quantity, sent to the right person. A high accuracy rate means fewer expensive returns and much happier customers.
On-Time Delivery Rate: How often do your packages actually arrive by the promised delivery date? This is a direct measure of customer satisfaction and a huge factor in whether they'll buy from you again.
Inventory Turnover: This metric shows how many times you sell and replace your entire inventory over a set period. A healthy turnover rate is a sign of strong sales and smart inventory management, preventing your cash from getting tied up in products that just sit on a shelf. You can find more details on this topic in our article about real-time inventory management.
Cost Per Shipment: This calculates the total expense to get an average order out the door, including packaging, labor, and what you pay the carrier. Keeping an eye on this helps you find ways to cut shipping costs and fatten up your profit margins.
These metrics are your command center. They give you an immediate gut check on what’s working and what needs fixing. The next step is knowing where to find the raw data to power them.
Uncovering Your Primary Data Sources
Here's the good news: you’re probably already sitting on a goldmine of data. The information is just scattered across the different software platforms you use to run your business. The real challenge isn't creating data from scratch—it's pulling it all together into one place.
A modern 3PL partner acts as a data refinery. They take the raw, scattered information from your systems and transform it into polished, actionable intelligence that you can use to make smarter business decisions.
Here are the most common places to find your logistics data:
Warehouse Management System (WMS): Your WMS is the heart of your fulfillment data. It’s packed with details on inventory levels, how long it takes to process an order, picking and packing accuracy, and how productive your team is.
Transportation Management System (TMS): This platform is all about movement. It holds all the data on carrier performance, transit times, on-time delivery rates, and freight costs. Digging into your TMS data helps you pick better routes and more reliable carriers.
E-commerce Platform (Shopify, Amazon Seller Central, etc.): Your sales channels provide the demand-side of the puzzle. This includes order volume, how fast certain SKUs are selling, customer locations, and return data—all of which are non-negotiable for accurate forecasting.
While the data exists, getting it all to play nicely together can be a huge headache. A recent industry survey found that 33.5% of logistics operations struggle to find solutions with strong analytical capabilities. This just goes to show that plenty of businesses know they should be using analytics, but they lack the right tools or partners to actually do it. You can learn more about these logistics market findings on stellarmr.com.
By understanding which metrics truly matter and where to find the data behind them, you lay the essential groundwork for a powerful analytics strategy that will actually drive growth and efficiency.
Putting Logistics Analytics into Practice
Theory is one thing, but results are what really matter. This is where we get our hands dirty and look at how analytics in logistics solves the real-world headaches e-commerce sellers face every day. Think of each use case as a problem solved—turning an operational nightmare into a serious competitive advantage.
To get the full picture, you need to see how the data flows. A solid data strategy connects the dots from your warehouse management system (WMS), through your transportation management system (TMS), and right into your e-commerce platform. It's a continuous feedback loop.
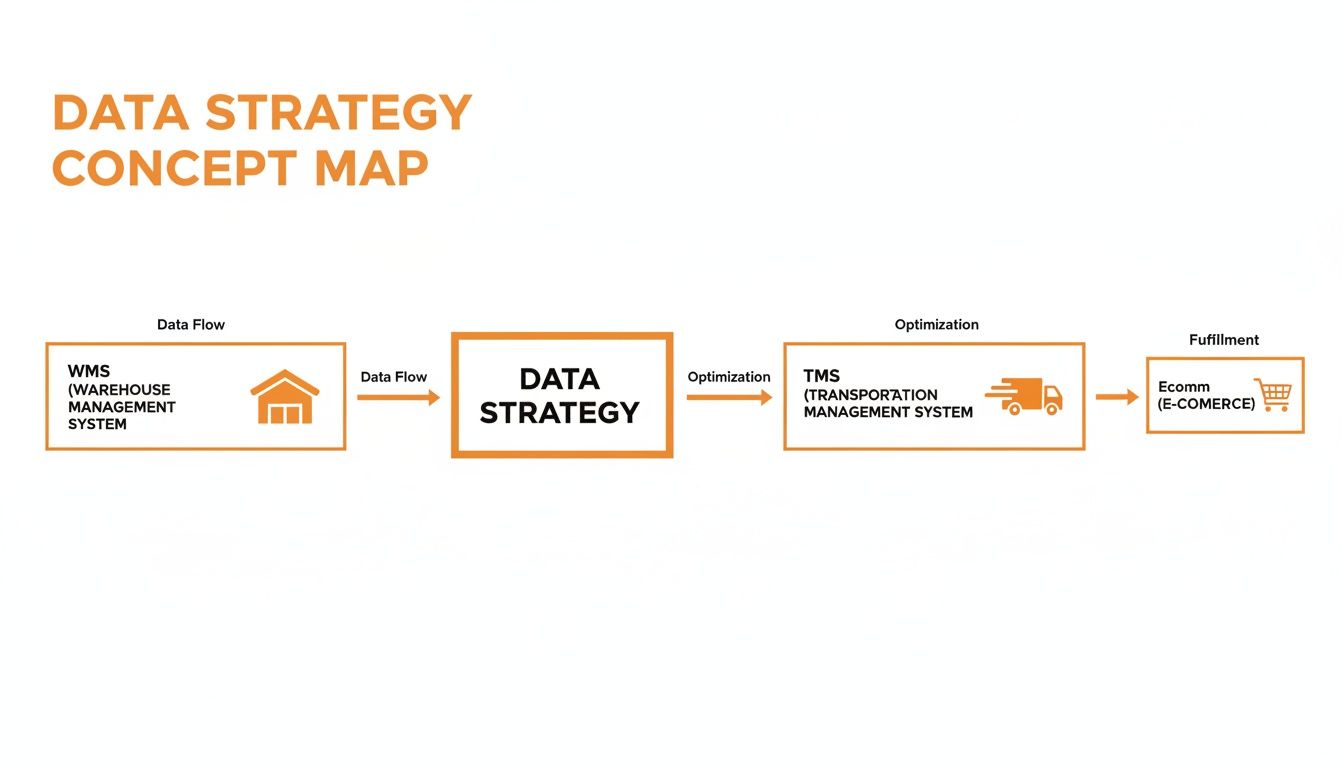
This map shows how the nitty-gritty operational data from your warehouse and shipping directly informs your sales channels, helping you make smarter, faster decisions.
Inventory and Demand Forecasting
Managing inventory is one of the trickiest balancing acts in e-commerce. Too much stock, and your cash is tied up in products that aren't moving. Too little, and you’re hit with stockouts and angry customers. Logistics analytics takes the guesswork out of the equation.
By digging into historical sales data, seasonal patterns, and market trends, predictive models can forecast what your customers will want with surprising accuracy. This means you can stock just enough of the right stuff at exactly the right time.
For instance, your analytics dashboard might show that sales for a specific SKU have shot up by 30% over the last two weeks. Instead of waiting for it to sell out, the system can flag it and recommend a reorder, ensuring you never miss a sale. This is a game-changer for modern inventory management. You can learn more about getting this set up in our guide on automated inventory tracking.
The goal here is to stop thinking of inventory as a static cost and start treating it like a dynamic, revenue-generating asset. Analytics makes sure every dollar you spend on stock is working as hard as possible.
And this isn't just a nice idea. In a recent study, nearly 78% of supply chain leaders said they’ve gained huge operational advantages from AI-driven logistics. In fact, 22% of businesses are already using AI for things like predictive demand forecasting.
Route and Carrier Performance Optimization
Shipping costs can absolutely demolish your profit margins, and slow delivery times are a great way to lose a customer for good. Analytics helps you tackle this head-on by putting every part of your shipping process under the microscope, from the routes you use to the carriers you choose.
Let's say you ship thousands of packages a month with a few different carriers. An analytics platform can automatically stack them up against each other based on what really matters.
- On-Time Delivery Rate: Who actually delivers when they say they will?
- Cost Per Mile: Which carrier gives you the best bang for your buck in different shipping zones?
- Damage Rate: Are your packages arriving in one piece, or are they getting beat up?
By crunching this data, the system can instantly tell you the best carrier for every single shipment. Maybe it’s Carrier A for coast-to-coast deliveries but Carrier B for anything regional. Those small, data-backed decisions save you money and keep your customers happy on every single order.
Warehouse and Fulfillment Efficiency
How fast and accurately your warehouse operates has a direct line to customer satisfaction. Analytics gives you a deep dive into your fulfillment process, shining a light on hidden bottlenecks you never knew you had.
You can track key metrics like pick-and-pack time, order cycle time, and order accuracy rate on a simple dashboard. It might reveal that orders with more than three items are taking 50% longer to process.
Once you know that, you can do something about it. Maybe you need to reorganize your warehouse layout, tweak your picking strategy for multi-item orders, or give your team some extra training. These small, informed changes add up to much faster and more accurate fulfillment across the board.
Optimizing Amazon FBA Prep
If you're an Amazon seller, you know FBA prep is serious business. One little mistake can lead to rejected shipments, expensive penalty fees, and lost sales while your inventory is stuck in limbo.
This is where analytics becomes essential. A 3PL partner like Snappycrate uses data to track and improve every single step of the FBA prep process, making sure it's done right the first time.
Data-Driven FBA Prep Checklist:
- Labeling Accuracy: We track the error rate on FNSKU labels to guarantee every item scans perfectly when it arrives at Amazon. No exceptions.
- Packaging Compliance: The data tells us if items are being correctly poly-bagged, bubble-wrapped, or bundled based on Amazon’s strict rules for that category.
- Shipment Plan Adherence: We use data to double-check that the items and quantities in every box match the shipment plan exactly, so you don't get hit with frustrating receiving delays.
By keeping a close eye on these metrics, we can spot recurring problems and fix them fast. This data-driven approach turns FBA prep from a major source of stress into a reliable part of your supply chain, getting your products to customers without a single hitch.
Your Step-by-Step Implementation Roadmap
Diving into logistics analytics can feel like trying to drink from a firehose. Between all the data, tools, and buzzwords, it’s easy to get overwhelmed before you even start. But here’s the thing: building a data-driven operation doesn’t require a PhD or a massive budget. It just takes a smart, step-by-step plan.
This roadmap cuts through the noise. It’s a practical, five-step process designed for any business ready to stop guessing and start measuring. We’ll go from identifying a single, core problem to building a culture that instinctively asks, "What does the data say?"
Step 1: Define Your Core Objective
Before you touch a single spreadsheet, ask yourself one simple question: What is the single biggest, most expensive problem I need to solve right now? Trying to boil the ocean is a surefire way to fail. Instead, channel all your energy into one high-impact area.
Maybe you're bleeding cash on shipping costs. Perhaps stockouts are killing your sales and eroding customer trust. Or it could be that your team is bogged down with complaints about slow or inaccurate orders. Whatever it is, pick one.
Defining a clear objective is like setting a destination in your GPS. Without it, you’re just driving aimlessly. Your goal could be as simple as, "Reduce our average cost per shipment by 10% in the next quarter."
This singular focus makes everything that comes next infinitely easier. You'll know exactly which data to hunt for and which metrics matter, keeping you from getting lost in a sea of irrelevant numbers.
Step 2: Identify and Consolidate Your Data
Right now, your operational data is probably scattered across a bunch of systems that don't talk to each other. You’ve got inventory data in your Warehouse Management System (WMS), shipping details in your Transportation Management System (TMS), and sales numbers in your Shopify or Amazon account.
The goal here is to find where this valuable information is hiding and pull it all together. This doesn't mean you need a complex, expensive data warehouse on day one. It can start with simple exports into a central spreadsheet or by leaning on the built-in integrations of a modern 3PL partner.
- For Inventory: Pull stock levels and order accuracy from your WMS.
- For Shipping: Grab on-time delivery rates and transit times from your TMS or carrier portals.
- For Sales: Collect order volume and sales velocity straight from your e-commerce platform.
A fulfillment partner like Snappycrate can act as your data hub, connecting these different sources to give you a single, unified view of your operations without you needing to manage all the technical plumbing.
Step 3: Select the Right Tools for the Job
Once you know your objective and where your data lives, it's time to pick your tools. The key is to start simple. Choose technology that fits your immediate needs and technical comfort level. You can always upgrade to more advanced solutions as you grow.
Here’s how most businesses progress:
- Spreadsheets (Google Sheets, Excel): This is the perfect starting point. They're free, flexible, and fantastic for basic tracking and building simple charts.
- Business Intelligence (BI) Tools (Tableau, Power BI): These are the next step up. They let you create interactive, automated dashboards that pull from multiple data sources.
- 3PL Dashboards: An analytics-focused 3PL gives you a purpose-built platform that visualizes key logistics metrics in real-time, requiring zero setup on your end.
Step 4: Build Your First Insights Dashboard
Your first dashboard should be ruthlessly simple. Its only job is to display the handful of key metrics that directly track the core objective you defined in step one. If your goal is to slash shipping costs, your dashboard has no business showing inventory turnover.
Focus on clean, easy-to-digest visuals. A line chart showing your cost-per-shipment over the last six months is far more powerful than a giant table of raw numbers. This visual approach helps you spot trends, flag problems, and track progress at a glance.
Step 5: Cultivate a Data-Driven Mindset
Tools and dashboards are only half the equation. The final, and most critical, step is to build a company culture that actually uses data to make decisions. This has to start from the top.
Encourage your team to shift away from making calls based on gut feelings or "the way we've always done it." Give them the power to ask questions and dig into the data to find real answers.
When a problem pops up, the first question should always be, "What does the data tell us?" This simple change transforms your entire operation from reactive to proactive, letting you use insights to solve problems before they ever reach your customers or your bottom line.
Measuring the True ROI of Your Analytics

Putting money into data can feel a bit abstract, but the returns are anything but. How do you actually prove that all this focus on analytics in logistics is paying off? The secret is connecting those data-driven insights directly to tangible, bottom-line results.
Your return on investment (ROI) isn't just one magic number. It's a powerful combination of gains across cost, revenue, and pure operational efficiency. By breaking it down, you can turn logistics analytics from a line-item expense into a proven profit center.
Significant Cost Reduction
The most immediate way analytics hits your finances is by systematically chopping down operational costs. Every dollar saved on shipping, storage, or returns goes straight to your bottom line. This is where data moves off a dashboard and into your bank account.
Think about it: without data, you might be consistently overpaying for shipping by choosing a carrier that’s fast but unnecessarily expensive for certain zones. Analytics puts a spotlight on these hidden costs instantly.
By analyzing carrier performance, transit times, and historical costs, you can uncover massive savings. Data helps optimize routes for lower fuel consumption and better fleet use, directly impacting your profitability on every single order.
This goes beyond just shipping, too. When you use accurate demand forecasts to guide your inventory, you stop overstocking and cut the high costs tied to warehousing slow-moving products.
Sustainable Revenue Growth
While saving money gives you an instant boost, the real long-term prize from logistics analytics is its impact on revenue. Getting orders to customers on time, every time, isn't just an operational goal—it's one of the most powerful drivers of customer loyalty and repeat business.
When a customer gets their order exactly when they expect it, their trust in your brand skyrockets. That positive experience is often the tipping point for their next purchase.
Here’s how analytics makes that happen:
- Improved On-Time Delivery: Data shows you which carriers are the most dependable, ensuring you meet or beat your delivery estimates.
- Reduced Stockouts: Predictive forecasting keeps your best-sellers in stock, so you don't lose sales to frustrated customers who go to a competitor.
- Fewer Order Errors: Tracking fulfillment accuracy helps you minimize mistakes, leading to happier customers and fewer costly returns.
Over time, this level of reliability builds a rock-solid reputation that attracts and keeps high-value customers, creating a sustainable engine for growth.
Enhanced Operational Efficiency
Finally, analytics delivers a powerful ROI by giving your team back its most valuable resource: time. When your team isn't drowning in manual report-pulling or firefighting preventable problems, they can focus on strategic activities that actually grow the business.
Automated dashboards replace hours of spreadsheet work, and real-time alerts flag potential issues before they cause a major disruption. For instance, an alert might show that pick times are slowing in a specific warehouse zone, allowing a manager to step in and fix it immediately. This shifts your team from being reactive to proactive.
Calculating the Impact of Logistics Analytics
Let's look at a practical breakdown of how specific improvements translate into measurable business gains. This isn't theoretical; it's how smart data decisions create real financial and operational wins.
| Analytics Improvement | Key Metric Improved | Direct Business ROI |
|---|---|---|
| Carrier Performance Analysis | Shipping Cost per Order | 5-10% reduction in overall shipping expenses by selecting the most cost-effective carrier for each route. |
| Demand Forecasting Models | Inventory Turnover Rate | 15% decrease in holding costs by preventing overstocking and minimizing slow-moving inventory. |
| Route Optimization Software | On-Time Delivery Rate | 10% increase in customer lifetime value (CLV) due to higher satisfaction and more repeat purchases. |
| FBA Prep Performance Tracking | Inbound Defect Rate | Reduced Amazon non-compliance fees and faster inventory receiving times, leading to more sales days. |
| Warehouse Labor Analytics | Orders Picked per Hour | 20% boost in labor productivity, allowing you to fulfill more orders without increasing headcount. |
As you can see, each data-driven action has a direct, positive reaction on your bottom line. It’s about making smarter, faster decisions that compound over time to build a more resilient and profitable business.
Your Analytics Questions Answered
Diving into logistics analytics can feel a little overwhelming at first. It’s a new way of looking at your business, so it’s totally normal to have questions. Let's tackle some of the most common ones we hear from e-commerce sellers just starting out.
Is My Business Too Small for This?
Absolutely not. In fact, analytics is one of the most powerful tools a smaller business has to compete with the big guys. It's how you punch above your weight.
Think about it: analytics helps you operate more efficiently, make smarter inventory buys, and keep shipping costs from eating into your profits. When every dollar counts, this isn't just a nice-to-have; it's a critical tool for survival and growth. It completely levels the playing field.
Do I Need to Be a Data Scientist?
Nope. You don't need a degree in data science or a pocket protector. The goal isn't to build complex algorithms from scratch—it's to get clear answers to your business questions.
A good 3PL partner will give you simple, easy-to-use dashboards that turn all that complicated operational data into insights you can actually use. Your job is to be curious and ask the right questions about your business; our job is to make sure the data gives you the answers.
The most important skill isn't coding—it's curiosity. If you can pinpoint a problem you want to solve, you have everything you need to use analytics. Your fulfillment partner should handle all the technical heavy lifting.
How Quickly Will I See Results?
You’ll see results come in stages. Some wins are almost immediate—like figuring out the cheapest shipping carrier for a specific route. You could see those savings hit your bottom line within the first month.
Other benefits, like fine-tuning your inventory levels based on sales forecasts, are more of a slow burn. These are the big, strategic improvements that might take a quarter or two to fully show up in your profits, but they’re what builds long-term financial health and a rock-solid operation.
What Is the First Step I Should Take?
Don't try to boil the ocean. The best way to start is to pick your single biggest headache. Is it sky-high shipping costs? Running out of your best-selling product? A frustrating number of inaccurate orders?
Once you’ve identified that one thing, have a real conversation with your fulfillment partner. A simple chat about your biggest challenge is the most effective first step you can take. It’s the starting point for building a data-driven solution that delivers real, measurable value.
Ready to turn your operational data into your greatest asset? Snappycrate provides the fulfillment expertise and analytics insights you need to scale smarter. Discover how we can help optimize your logistics at https://www.snappycrate.com.