You can feel this problem before you can see it on a report.
Orders are flowing in. Your Shopify store is busy. Amazon replenishment is moving. Revenue looks healthy. Then you review the month and ask the same frustrating question many growing brands ask: why did sales go up while profit got tighter?
In e-commerce, that usually means you're tracking revenue well enough, but not the cost of serving each order, customer, and channel. Standard calculators usually stop at pick, pack, and postage. They rarely capture the extra touches, compliance work, exception handling, returns labor, or the hidden cost of fixing preventable mistakes after the order leaves your dock.
That gap is where margin disappears.
Why High Revenue Does Not Always Mean High Profit
Your Shopify sales spike after a promotion. Amazon starts pulling more replenishment units. The dashboard looks strong, but the month closes softer than expected. That usually means the extra orders brought extra handling that never showed up in your margin assumptions.
Revenue does not measure effort. It measures volume.
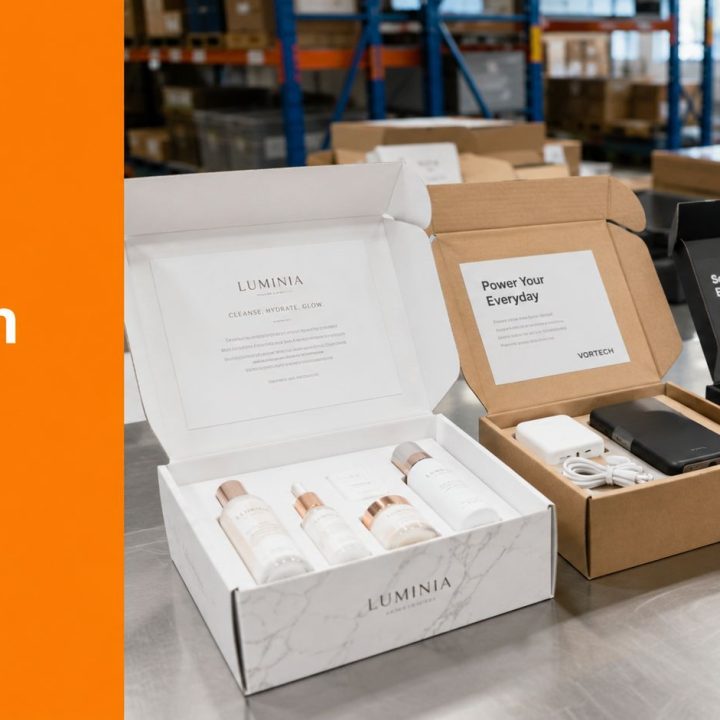
In e-commerce, the brands that get surprised are often the ones selling well across multiple channels without tracking the messy work behind each order. A large wholesale account may look attractive until its orders keep missing carton labels and your team has to relabel pallets before they can ship. A fast-growing Amazon SKU may look profitable until small prep mistakes turn into chargebacks, refused inbound shipments, or labor-heavy rework. A DTC product line may post solid top-line sales while returns, exchanges, and support tickets eat the contribution margin.
I see this most often with brands that rely on standard fulfillment calculators. Those tools usually cover storage, pick, pack, and postage. They rarely capture the variable costs that move profit in a 3PL operation, like FBA prep corrections, split shipments caused by inventory imbalance, address exceptions, packaging upgrades for fragile items, or the labor to inspect and restock returns.
Those costs are not side issues. They are the reason one high-revenue channel can produce less profit than a smaller, cleaner one.
Revenue rewards demand. Profit rewards operational discipline
A customer with lower sales can be more valuable if their orders are consistent, their cartons arrive compliant, and their return rate stays under control. A bigger customer can do the opposite if they generate manual touches at every step. More order edits. More prep requirements. More replacement shipments. More after-the-fact problem solving.
That is where growing brands need a sharper operating lens. The question is not only, "How much did this channel sell?" The better question is, "How much warehouse labor, exception handling, carrier cost, and post-purchase support did this channel create?"
That distinction matters even more on newer channels. TikTok Shop can drive fast order volume, but it can also expose weak pricing assumptions if the business is not accounting for service costs correctly. HiveHQ's guide for TikTok Shop sellers is useful because it pushes that conversation past gross sales and into real order economics.
A specialized 3PL helps by reducing the hidden work before it turns into margin loss. Better receiving controls catch prep issues earlier. Clear SOPs reduce relabeling and repacking. Returns workflows separate resellable inventory from damaged units faster. Channel-specific handling rules keep Shopify fulfillment, retail compliance, and Amazon prep from being managed like the same job when they are not.
The practical takeaway is simple. If a SKU, customer, or channel creates more touches than your price structure can absorb, higher revenue will not fix the problem. It will scale it.
What Is Cost of Serving in E-commerce
A brand can clear strong top-line sales on Shopify, Amazon, and wholesale, then still watch margins slip because the order economics were wrong from the start. The missing piece is usually cost of serving. It captures the labor, storage, shipping, exception handling, and post-purchase work required to support each order.

The all-in view of an order
In e-commerce, cost of serving is the full operational cost of supporting a sale from inbound receipt through final delivery, and often through returns. Product cost and postage are only part of it. The key question is how much work, space, and corrective effort the order created across the business.
For a growing brand, that usually includes:
- Before the order ships: listing setup, channel-specific requirements, customer support before purchase, and any order review needed to prevent fraud or address edits
- Inside the warehouse: receiving, inspection, putaway, storage, picking, packing, labels, inserts, kitting, and prep work such as poly bagging or FBA relabeling
- In transit: carrier charges, surcharges, address issues, reships, and delivery exceptions
- After delivery: returns processing, replacement orders, claims, restocking decisions, and support tickets
That last bucket is where many brands undercount. A return is not just refunded revenue. It can mean opening the package, checking item condition, deciding whether it can be resold, updating inventory, and sometimes repacking it for a different channel. If FBA prep was missed on the original outbound order, the same unit may get touched twice.
Why average costs hide margin leaks
Blended fulfillment averages look clean in a spreadsheet, but they hide the orders that create the most drag on margin.
A single-SKU Shopify order with no edits and no return may move through the warehouse fast. An Amazon order that needs expiration labels, bundling checks, carton content verification, and replacement handling after a receiving rejection is a different job entirely. Both count as orders. They do not consume the same labor.
That is why good cost-of-serving models assign costs based on the activities that happened. The method does not need to be complicated. It needs to reflect reality. If one channel drives more manual touches, more support tickets, or more returns, it should carry more cost.
From an operations standpoint, this is where a specialized 3PL earns its keep. Strong receiving controls catch prep problems before inventory is booked in. Clear SOPs reduce relabeling and avoidable repacks. A tighter returns workflow shortens the time between receipt and resale decision. Brands that also tighten their inventory management process for growing e-commerce operations usually get a cleaner cost picture because inventory errors stop distorting fulfillment labor and storage.
A useful cost of serving model should show where the business is spending time, not just where invoices happen to land.
Four cost buckets most brands should track
A practical model usually starts with four buckets.
| Cost bucket | What belongs in it |
|---|---|
| Pre-sale costs | Listing work, support before purchase, fraud review, channel setup |
| Fulfillment costs | Receiving, storage, order processing, picking, packing, materials, prep work |
| Delivery costs | Parcel charges, surcharges, address corrections, reships, delivery exceptions |
| Post-sale costs | Returns, exchanges, claims, support tickets, inspection, restocking, disposal |
The goal is clarity, not accounting theory. If a brand can trace cost back to real warehouse actions and channel behavior, pricing decisions get sharper, channel profitability gets easier to compare, and service problems stop hiding inside a blended fulfillment rate. Teams that want better discipline around categorizing these operating expenses can also use this modern expense tracking guide to clean up how costs are captured before reporting begins.
Identifying Your Biggest E-commerce Cost Drivers
A brand can have strong sales on Shopify, a healthy Amazon sell-through rate, and still watch margin slip every month. The usual reason is not one big bill. It is a stack of variable operating costs that sit between the click and the cash, especially the ones a simple fulfillment calculator leaves out.

The cost drivers that show up in every fulfillment operation
Across fulfillment operations, three buckets usually carry the most weight: warehousing, pick and pack labor, and transportation. Research cited in the PMC analysis also points to a less visible issue for e-commerce brands. Prep and handling mistakes can push serving costs up fast, particularly in Amazon workflows where compliance errors trigger rework, delays, and extra touches.
Those buckets matter because they explain where margin goes. They become useful once they are tied to actual warehouse activity, channel rules, and SKU behavior.
Warehousing costs start before a product hits the shelf
Storage charges are only part of the picture.
Real warehousing cost includes appointment scheduling, unload labor, receiving checks, putaway, bin placement, cycle counts, replenishment, and the carrying cost of inventory that sits too long. A brand with uneven inbound flow or poor carton labeling usually pays more here because every exception creates another touch.
Layout matters too. If fast sellers are buried, if bundles are assembled far from packing stations, or if replenishment is late, labor cost rises across the whole operation. Brands that tighten their inventory management best practices for growing brands usually see the benefit in lower handling time, fewer stock errors, and cleaner fulfillment data.
Pick and pack cost rises with order complexity
A one-line order for a single beauty SKU is cheap to process. A three-unit order with tissue wrap, inserts, expiry checks, lot tracking, and custom labeling is a different job.
Flat fulfillment rates hide that difference. Actual cost shows up in labor minutes, station congestion, dunnage use, quality checks, and error rates. I have seen brands treat two orders as equal because the order value matched, even though one took three times the labor to get out the door.
Channel mix adds another layer. Shopify orders may need branded presentation. Amazon shipments may require FBA prep steps like polybagging, suffocation labels, case-pack rules, or carton content accuracy. Wholesale orders often bring pallet labels, routing compliance, and appointment coordination. Each one changes cost to serve.
Transportation includes every shipping exception
Carrier spend is only the starting point.
The full cost includes dimensional weight surprises, residential surcharges, address corrections, reroutes, split shipments, lost package claims, and the customer service time tied to delivery issues. Brands also absorb cost when warehouse delays force expedited shipping to protect seller metrics or customer experience.
Good reporting matters here. If parcel charges, packaging purchases, and support-related shipping credits are scattered across systems, the cost model breaks down. Teams trying to clean that up can use this modern expense tracking guide as a practical reference for capturing costs consistently.
Hidden variable costs usually sit in prep work and returns
This is the area standard calculators miss most often.
FBA prep errors are a common example. A missed label, incorrect bundle configuration, or non-compliant carton does more than create a one-time fee. It creates rework, delays check-in, ties up labor, and can extend storage time on inventory that should already be available for sale. For Amazon-heavy brands, that can change the margin profile of a SKU far more than the quoted pick fee.
Returns do the same thing on the back end. A returned unit has to be received, opened, inspected, graded, restocked or quarantined, and recorded correctly. Some items need new packaging. Some need disposal. Some trigger a support ticket and a replacement shipment. If one product line has a high return rate or one sales channel drives more exchanges, your cost to serve is higher there even if outbound fulfillment looked efficient.
This is one reason specialized 3PLs outperform generic models. A 3PL that handles FBA prep correctly the first time, flags repeat return reasons, and separates profitable SKUs from expensive ones gives a brand more than warehouse space. It gives the brand a clearer path to protect margin. That is where Snappycrate adds value, by reducing preventable touches before they become hidden cost.
How to Calculate Your Cost of Serving with Examples
A brand can ship 3,000 orders in a month, see healthy top-line sales, and still lose margin on half its catalog because the spreadsheet only captured pick, pack, and postage.
That happens all the time in e-commerce. The missing costs usually sit in the work around the order. FBA prep corrections, split shipments, customer service time, replacement orders, and returns inspection. If you want a cost-to-serve model you can use, build it around those touches instead of relying on a flat average cost per order.
Start by choosing the level of analysis. For growing brands, the three views that matter are SKU, channel, and customer.
Start with the formula
Use a practical formula:
Cost of serving = all direct and allocated costs required to receive, store, fulfill, ship, support, and process returns for a product, order, channel, or customer
The formula is simple. The discipline is in the allocation.
Some costs are easy to trace, like parcel spend, packaging, or a paid FBA labeling service. Others need to be assigned using a driver such as order count, units handled, storage footprint, return rate, or support time. If the driver is wrong, the output is misleading.
Include overhead. Brands often skip software, warehouse management time, and systems support because those costs feel indirect. They are still part of serving the order. Esker notes that infrastructure and support costs can materially affect cost allocation decisions in service models, including monthly overhead that can run into the thousands for integrated operations, in its cost allocation discussion.
Example by SKU
At the SKU level, the question is straightforward. Does this item produce enough margin after fulfillment reality is included?
Use this structure:
- Product revenue per unit
- Product cost per unit
- Inbound handling allocation
- Storage allocation
- Pick and pack labor allocation
- Packaging material allocation
- Shipping allocation
- Return and support allocation
- Technology and overhead allocation
A simple example helps.
Say a supplement brand sells a $14.99 SKU on Shopify. Product cost is $4.20. Standard pick, pack, and packaging add $2.10. Shipping adds $4.80. On paper, the unit still looks healthy.
Then the hidden costs show up. The item needs a suffocation warning label for some marketplaces, 12 percent of orders trigger address corrections or replacements, and returns often come back with damaged outer packaging that prevents restock. Add even modest prep rework and return handling, and the true cost to serve can erase the margin you thought you had.
That is why operators separate normal handling from exception handling. If one SKU keeps needing relabeling, kitting fixes, or replacement shipments, it should carry those costs directly.
Example by channel
Channel analysis shows where the operational load changes.
A lot of brands assume Amazon is cheaper because volume is higher, or that Shopify is more profitable because the gross margin is better. Neither conclusion is reliable until you account for channel-specific work.
| Channel view | Common extra costs to include |
|---|---|
| Shopify | Branded packaging, direct support, individual returns handling |
| Amazon FBA replenishment | Prep, labeling, bundling, compliance checks, case-pack handling |
| Walmart Marketplace | Routing requirements, channel-specific support, packaging rules |
| Wholesale | Palletization, freight coordination, documentation, appointment handling |
Here is a common pattern I see. Shopify orders may cost more in parcel spend and support, but Amazon replenishment can become more expensive once carton compliance errors, prep labor, and shipment rejections are added back in. One missed FNSKU label can create a chain of rework that a standard shipping calculator never captures.
Brands that want cleaner landed fulfillment economics should pair this analysis with a review of ways to reduce shipping costs without hiding service trade-offs.
Example by customer
Customer-level cost of serving is where margin leaks become hard to ignore.
Use a spreadsheet like this:
| Metric | Value |
|---|---|
| Customer revenue | Enter total revenue from the customer |
| Cost of goods sold | Enter total product cost |
| Receiving and inbound handling | Allocate based on inbound volume or units |
| Storage cost | Allocate based on space used and time stored |
| Order processing | Allocate by order count |
| Picking and packing | Allocate by units, lines, or labor time |
| Packaging materials | Enter actual or estimated material usage |
| Shipping and delivery | Enter carrier cost plus exceptions |
| Returns processing | Allocate based on returned units or return labor |
| Customer support time | Allocate based on tickets or account management effort |
| Technology and overhead | Allocate by orders, units, or revenue share |
| Total cost of serving | Sum all cost lines above |
| Customer profit | Revenue minus cost of goods sold minus total cost of serving |
Now compare two customers.
Customer A places ten small Shopify orders a month, asks for frequent address changes, and returns 18 percent of units. Customer B places two larger orders, rarely contacts support, and almost never returns product. Customer A may produce more revenue and more order volume, but after support time, extra picks, reships, and returns processing are allocated, Customer B is often the more profitable account.
That is the point of the exercise. It replaces assumptions with numbers you can act on.
What works and what distorts the model
What works:
- Use the same allocation logic each month. If storage is assigned by cubic footage or bin usage, keep that method stable.
- Track exception costs separately. Rework, relabeling, failed FBA prep, and return inspection should not disappear into general warehouse labor.
- Start with a spreadsheet you will maintain. A simple model used every month beats a detailed model nobody updates.
- Review with your 3PL. A specialized 3PL can usually identify where touches are being created, then remove them through better prep standards, routing controls, and returns workflows.
What distorts the model:
- Using one average cost per order across every SKU and channel
- Leaving out support labor and warehouse management overhead
- Treating returns as a separate issue instead of part of fulfillment economics
- Ignoring prep failures that only show up after inventory reaches Amazon or the customer
A good 3PL helps reduce the cost. A better one also makes it visible. Snappycrate adds value here by tracking the operational work generic models miss, especially prep-related exceptions, channel-specific handling, and returns touches that directly change SKU and customer profitability.
Actionable Strategies to Lower Your Serving Costs
Once you know where the cost is coming from, the next move is operational. The fastest wins usually come from removing friction. Not from squeezing labor harder.
For fulfillment operations, the key lever for profitability is reducing order friction and average handling time. Optimizing those factors improves marginal costs per order and supports more competitive pricing, based on the verified data tied to Kevin Holland's pricing framework discussion.

Fix the warehouse flow first
A lot of brands try to lower cost of serving by negotiating rates before they fix process waste. That's backward.
If pick paths are messy, fast-moving SKUs are badly slotted, and staff keep searching for packaging or relabeling inventory, you're paying a hidden tax on every order. Cleaner slotting, tighter replenishment habits, and better station setup cut the small delays that pile up all day.
Remove avoidable touches
Every extra touch is a cost.
That includes opening inbound cartons twice, reprinting labels, repacking damaged units, splitting work across too many stations, or correcting order edits after release. These activities rarely show up in standard pricing conversations, but operators feel them every shift.
Use a short audit:
- Map handoffs: Count where an order pauses or changes hands.
- Flag repeat exceptions: If the same issue appears daily, treat it as a process defect.
- Separate custom work: Kitting, inserts, and channel-specific prep should be operationally isolated so they don't slow standard orders.
The cheapest order to fulfill is usually the one that moves through the building once, with no corrections.
Change order shape, not just order cost
You can often lower cost of serving by changing how orders are built.
Bundling and kitting can reduce repeated handling. Clearer prep standards can eliminate relabeling loops. Better packaging design can reduce damage and returns. Tighter reorder planning can reduce emergency inbound work.
These aren't accounting fixes. They're workflow fixes.
Shipping is part of this too. If your packaging choices create dimensional weight problems, or your release process pushes too many late-day premium shipments, your cost issue starts upstream. Tactics in this guide on how to reduce shipping costs for e-commerce fulfillment are most effective when paired with process cleanup, not treated as a standalone carrier exercise.
Know when specialization beats internal patchwork
General fulfillment setups struggle when channel requirements get more technical.
Amazon prep, multi-channel routing, branded packaging, and returns handling all create variation. If your team is trying to run those workflows through one generic process, costs rise because mistakes and rework rise. Specialized handling matters most when the business has real compliance risk or high order complexity.
What usually doesn't work is trying to solve a structural fulfillment issue with more spreadsheets, more rush jobs, and more manual checkpoints. That only hides the friction temporarily. The better approach is a workflow built around the actual requirements of your channels and product mix.
Turning Analysis into Action with KPIs and Reporting
A one-time cost of serving exercise helps. A repeatable reporting habit changes the business.
The goal is to turn your findings into operating discipline. That means a small set of metrics reviewed on a fixed cadence by the people who can change pricing, packaging, routing, inventory placement, and service levels.
KPIs worth tracking consistently
You don't need a crowded dashboard. You need metrics that connect cost to daily behavior.
Track a working set like this:
- Cost per order: Watch for shifts by channel and order type.
- Profitability by customer segment: Group by account type, order pattern, or service complexity.
- Return rate by SKU: This highlights products creating repeat reverse-logistics cost.
- Order fulfillment cycle time: Slow flow often signals friction, congestion, or rework.
- Exception volume: Track relabeling, repacks, order edits, address issues, and carrier exceptions.
- Storage aging by SKU: Slow inventory usually creates both space cost and handling drag.
A useful dashboard should also connect warehouse activity with finance. If your operations data and accounting data live in separate worlds, your cost of serving model will drift out of date.
That's where stronger reporting infrastructure matters. A practical starting point is building logistics visibility around the kinds of workflows described in analytics in logistics for modern fulfillment operations.
Use a simple reporting rhythm
Monthly reviews are usually enough for tactical adjustments. That's where you catch rising return pain, labor-heavy SKUs, or a customer account that is starting to consume too much support time.
Quarterly reviews are better for structural decisions. That's when you revisit pricing logic, channel strategy, packaging changes, and whether a workflow should be redesigned rather than patched.
Don't wait for margin problems to show up in the quarterly financials. By then, the warehouse has usually been telling you the story for weeks.
Keep the process simple. Review the same KPIs, compare against the previous period, and ask three direct questions:
- Which orders are getting harder to serve?
- Which costs are increasing without a pricing response?
- Which exceptions can be eliminated instead of managed?
That habit is what turns cost of serving from a report into a management tool.
If your brand is scaling across Amazon, Shopify, or Walmart and you need a fulfillment partner that understands the true cost of serving, Snappycrate can help. From storage and order fulfillment to FBA prep, labeling, bundling, and inventory workflows, the team is built for sellers who want cleaner operations, fewer compliance issues, and better margin control as volume grows.